Friday, December 3, 2010

Census


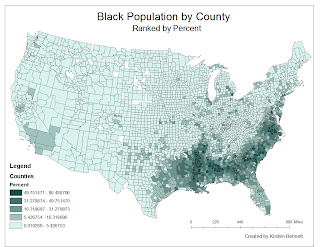
This graph represents the percentage of African Americans living in each county in the United States. The darker green represents a higher percentage of blacks- this higher percentage is clustered in the South. There is also a trend of increased percentage surrounding the Mississippi River. The census shows that there are counties in the Midwest in which the population of African Americans is zero.

This map is the percentage of Asians per county. Here dark purple represents a higher percentage. America's Asian population tends to be on the west coast, mainly in California. Here there are also counties in which the population of Asians is zero, but not as many. 

This map shows all other races that represent a significant percentage in a county. Dark red is a higher percentage. This map clearly shows a trend toward the the south western United States, ranging from Texas to California to Washington. 

Each of these maps show the trend of immigration into the United States. The black population mainly arrived from Africa in America's early history to work on plantations in the South. For this reason, African American population is still centered in the South. Since Asia is located to our west, is is logical that most Asians would settle in California. Also, from the "Other" Race Population map, it would be logical to conclude that "other" includes people of Hispanic origin because the deepest red is centered near the Mexican border. 
One other important aspect to note is that for counties in which the population is labeled as zero, this means that there are no people of that race reported as living there. This can mean either that there are no people of that race living in that county, or that no people of that race responded to the census. 

(These maps were created from census data from 2000)


In this quarter I have learned that GIS is a useful tool that can be applied to many different fields. I create raster maps for the research that I am a part of, and it was extremely enlightening to learn to use a different program to create different types of maps. GIS is a helpful program, partly because it is so user friendly. At the touch of a button, you can reposition your data or create an aesthetically pleasing map. Also, all the data about your map is stored within the map so you can easily compare percentages or locations of schools. Overall, my opinion of GIS is very positive, and I would be interested in learning more about it!

Tuesday, November 16, 2010

Station Fire

Figure 1

Figure 2

Figure 3
Figure 4

Figure 5

Figure 6

Figure 7

There is much to learn from the California Station Fire that occurred in 2009, especially with respect to political district lines. Figures 2 through 7 show the Congressional, Senate, and California State Assembly districts that were directly affected by the Station Fire. I am concerned  about the policy and funding behind fire stations.
                The source of funding varies for different fire stations, but they include sources such as municipal, county, state, and national governments².I am interested in the correlation between who is paying for the fire stations and the range of the various districts, focusing mainly on the Congressional Districts. Figure 3 shows that the Station Fire touched four different Congressional Districts, while Figure 2 shows the extent of each of these districts. It is interesting to note that District 25 covers much more area than any of the other districts. The inhabitants must be very spread out, but this means that people who live in Northern/Central California will be responsible for paying for relief for a fire that was hundreds of miles away from them.
                The reactions of various politicians to the Station Fire can be correlated to which district they belong to. In a Los Angeles Times article, both Senators and five Representatives signed a bill asking “Congress’ investigative arm to launch a sweeping probe” about the response time to the Station Fire. Upon further research, I found that four of the Representatives correspond to the four districts directly affected by the fire, while the fifth Representative was District 32- located directly below District 26. These Representatives would want to make sure that the firefighters in their districts were doing the best they possibly could so that in the future, such deadly fires could be avoided. The Senators would be concerned with the Station Fire because they are responsible for all of the voters in California, which includes the people affected by the fire.
One of the reasons that the politicians would support such a bill is that the largest fire in Los Angeles County history occurred while they were in office. For the safety of their constituents, and to ensure they will not blame their government for the fire, these politicians asked for an in depth investigation.
The cost of fire departments is on the rise. The expenses for paying fire fighters and buying supplies are going up, while revenues are going down³. For this reason, it is important that we check that fire departments are effective. The bill that these Californian politicians signed is an important step in that process. Hopefully, in the future politicians whose districts were not directly affected by the Station Fire will support bills such as this one, since wild fires are a threat across the state.


Works Cited
  1. CAL FIRE Home. Web. 23 Nov. 2010. <http://www.fire.ca.gov/>.
  2. "Fire Department." Wikipedia, the Free Encyclopedia. Web. 23 Nov. 2010. <http://en.wikipedia.org/wiki/Fire_Department>.
  3. Hill, John R. "Fire Department Funding - The 4 Upcoming Critical Financial Issues That Will Rock Your World." EzineArticles. 8 July 2008. Web. 23 Nov. 2010. <http://ezinearticles.com/?Fire-Department-Funding---The-4-Upcoming-Critical-Financial-Issues-That-Will-Rock-Your-World&id=1276194>.
  4. Pringle, Paul. "Lawmakers Seek Broad Probe into Forest Service Response to Station Fire - Los Angeles Times." Los Angeles Times. 06 Aug. 2010. Web. 23 Nov. 2010. <http://articles.latimes.com/2010/aug/06/local/la-me-station-fire-20100806>.
  5. Pringle, Paul. "Station Fire: Lead CDF Air Attack Officer Contradicts Forest Service Report." CALIFORNIA FIRE NEWS. 06 July 2010. Web. 23 Nov. 2010. <http://calfire.blogspot.com/2010/07/station-fire-lead-cdf-air-attack.html>.
  6. "Representatives By State." United State House of Representatives. U.S. House of Representatives. Web. 22 Nov. 2010. <www.house.gov>. 


Tuesday, November 9, 2010

Grand Canyon in 3-D


 The Grand Canyon!!

This is the 3D Digital Elevation Model I created from data of the Grand Canyon.


Below is the aspect model. It is very colorful.
Above: The color ramped DEM. Blue is low and brown is high altitude. I chose this one because it reminds me of the brown desert with a river cutting through it.
Below: The color ramped DEM layered with the hillshade model.
To the left is the hillshade model I created.


Below is the slope model.... It is entirely red. This supposedly means that EVERYWHERE had an extremely steep slope. We know this is not the case because besides the canyon, Arizona is very flat. Several other people's slope models did not work, so my TA, Patrick, said we could include this weird red one.
I selected the Grand Canyon to do this assignment because it has a lot of topographical relief so you will be able to see drastic changes in altitude.

The extent of this DEM:
Top: 36.468
Right: -111.640
Bottom: 36.057
Left: -111.966

GCS:
GCS_North_American_1983

Map Projections


Questions Answered!
-The equator is close to 360 decimal degrees
-The northern and southern most graticule lines are also 360 degrees
        -They represent the north and south poles- they are just a point!


Conformal:
Mercator
Gall Stereographic

Equidistant:
Plate Carree
Sinusoidal

Equal Area:
Mollweide
Bonne

Using map projections is a necessary and dangerous game. Map makers can influence the way people think simply by choosing a different map projection. For example, in my "Equal Area" picture, Washington D.C. and Kabul look fairly close to each other in the Bonne map projection, while they look much further apart in the "GCS WGS 1984" projection.

It is also interesting to note that the distance between two points on a globe can change depending on the map projection you use. The distance from Washington D.C. to Kabul ranged from 6,700 miles to over 10,000 miles for my seven map projections. This can be extremely confusing, especially if you are using the maps to navigate.

Projections can be very helpful, though. No matter what you need a map for, there is most likely a projection that can help you display your data better. For example, if you want to map the temperature of the equator, you can use a Gall Stereographic map. This map gets skewed at the poles, but it does not matter for your purposes. If you want to map the temperature of the South Pole, there are specific polar projections you can use.

Different map projections can also liven up a map display. It can be more interesting to look at Bonne and Sinusoidal projections than many rectangular ones.

Tuesday, November 2, 2010

GIS


GIS as a data processing system has many pros and cons. Here are some things I discovered about it:

GIS is very user friendly. It is easy to learn to use because there is a lot of pointing and clicking- you don’t need to know any computer programming. It is also very aesthetically pleasing. You can change the colors of the background, add legends, and put little boxes around maps with very little effort. In GIS, you can relate the different maps and datasets to each other.
 It was simple to add a graph that displayed quantitatively what the map was showing qualitatively. You can also overlay different data sets easily by scaling them or adding an entire data column to a different layer. As a viewer, it is easy to tell what is going on in a GIS map because the legends are extremely helpful.
Even though we put in a bar graph, I feel as if GIS is very focused on the visual, qualitative aspects of graphs. This can be a good thing, but it might make analyzing data sets a little more difficult. Also, it was easy to add updates to the data/map (we added a new road), but it seemed unprofessional. Perhaps that is how all new roads are added, but I was concerned by how easy it was. You could just add whatever you wanted to without verifying that it is correct. You just pointed and clicked at where you wanted to go- there were no measurements or checks that the new road actually intersected the old road where we said it did. Maybe we will learn how to be more precise in the future.
Another thing I noticed was the importance of saving things in the correct places. This is something users have to learn to be exact about. I had to backtrack once because I saved a file in a space that was only one folder away from where it needed to be, but it may as well have been on a different computer since GIS could not find it. GIS is also very expensive. Most of the students in this class will probably never use GIS again, simply because we would never be able to pay $10,000 for a data processing system.


Monday, October 18, 2010

Abundance of Austen

http://maps.google.com/maps/ms?hl=en&gl=us&ie=UTF8&oe=UTF8&msa=0&msid=115754350583819625043.0004926e9974a5712fc14

The link above shows a map of England with notable places from the life and times of Jane Austen. Any self-acclaimed Janeite dreams of touring the Lake District, visiting the infamous region of Lyme, and seeing the splendor of Bath. She (or he) might even throw a temper tantrum worthy of Lydia to get her (or his) way- cue "But I want to go to Brighton!!!"
I have created a map to aid any Janeites in their tour of England. In blue, I have included several locations related to Jane Austen, such as her birthplace. Many places mentioned in her novels are fictional (sadly, Pemberly is included on the fictional list- you'll have to try elsewhere to find your Mr. Darcy). However, you can actually visit some locations from the novels. I tagged several of them in purple. Enjoy!

NEOGEOGRAPHY

Neogeography means "new geography." It is a form of map making in which people can "do it themselves." Some of the pitfalls of neogeography are that you don't always know whether the map is correct. There is no way to check a cartographer's sources. Using my map above as an example, an average non-Austen reader and Google user who stumbles across my map would not be able to tell if I actually included places relating to Jane Austen or simply made up the back stories about each location. (In case you were wondering, I did not make them up. All credit goes to Jane.) Also, if someone were to actually plan a vacation using my map, how would they know that I actually put Box Hill's marker on Box Hill? I could be trying to advertise for a restaurant and a traveler could wind up at a local bakery, or something more sinister. A pitfall of neogeography is not knowing if you can trust the creator of the map.
On the other hand, neogeography has boundless potential. People in highly specialized areas (such as fans of Jane Austen) can create maps that are relevant to them very easily without having to pay some company or the government to do it for them. You can send directions to your house via email to your study group so they don't have to consult an atlas. It makes navigating the world much easier. A consequence of neogeography is including more people. When you had to have official paper maps, it was difficult to deal with geography. Now, theoretically, even a child could go onto Google maps and figure out how to walk to school. It eliminates some of the reliance we have on government bodies to create up to date maps, as we can now do that ourselves. However it also creates a question as to how we are going to regulate new maps and whether that is even possible.

Tuesday, October 12, 2010

9021oh!

WEEK 2
1. What is the name of the quadrangle?
Beverly Hills, CA
2. What are the names of the adjacent quadrangles?
Canoga Park, Van Nuys, Burbank, Topanga, Hollywood, Venice, Inglewood
3. When was the quadrangle first created?
1995
4. What datum was used to create your map?
National Geodetic Vertical Datum of 1929
5. What is the scale of the map?
1:24,000
6. At the above scale, answer the following:
a) 5 centimeters on the map is equivalent to how many meters on the ground? 
1200 meters
b) 5 inches on the map is equivalent to how many miles on the ground? 
1.8939 miles
c) one mile on the ground is equivalent to how many inches on the map?
2.64 inches
d) three kilometers on the ground is equivalent to how many centimeters on the map?
12.5 cm
7. What is the contour interval on your map?
20ft
8. What are the approximate geographic coordinates in both degrees/minutes/seconds and decimal degrees of:
a) the Public Affairs Building;
lat: 34 deg 04' 25" lon: 118 deg 26' 15"
lat: 34.0736 deg lon: 118.4375 deg
b) the tip of Santa Monica pier;
lat: 34 deg 00' 28" lon: 118 deg 29' 55"
lat: 34.00778 lon: 118.4986
c) the Upper Franklin Canyon Reservoir;
lat: 34 deg 07' 20" lon: 118 deg 24' 33"
lat: 34.1222 lon: 118.4091
9. What is the approximate elevation in both feet and meters of:
a) Greystone Mansion (in Greystone Park); 
560 feet; 170.69 meters
b) Woodlawn Cemetery;
140 feet ; 42.67 meters
c) Crestwood Hills Park;
700 feet; 213.36 meters
10. What is the UTM zone of the map?
zone 11
11. What are the UTM coordinates for the lower left corner of your map? 
37629500 Northing; 361450 Easting
12. How many square meters are contained within each cell (square) of the UTM gridlines?
1,000,000 meters^2
13. Obtain elevation measurements, from west to east along the UTM northing 3771000, where the eastings of the UTM grid intersect the northing. Create an elevation profile using these measurements in Excel:


14. What is the magnetic declination of the map?
14 degrees
15. In which direction does water flow in the intermittent stream between the 405 freeway and Stone Canyon
Reservoir? 
South
16. Crop out UCLA from the map and include it as a graphic on your blog.


Tuesday, September 28, 2010

Maps from ALL over

The first assignment in Geography 7 starts... now!


Zakynthos
A Grecian Island in the Ionian Sea

This island in Greece is called Zakynthos, and from the pictures I saw, it looks beautiful. I found this geographical map on a tourism website for the island, so it mainly shows places and things that a tourist might want to know about. Included are mountains, beaches, main cities and roads, and the airport. The website was in English, but the map is in Greek, which (in my opinion) adds to the exotic appeal of the island. On the website the map is interactive- by scrolling over different parts of the island you can see what tourism activities are available in each place. I enjoyed looking at this map because I got to read a little about the island while looking at it. If you want to check it out, I found the map here:

 Phnom Penh
Cambodia

This is a street map of Phnom Penh during the Asian Festival of Inclusive Arts which I found on the festival's website. The background I read about the festival says that it is designed to raise awareness about including people with disabilities in everyday society. In red, the map shows the different venues in which events took place at the festival. It also includes every street name, and most of them are numbers. I suppose this makes sense and would make it easy to get around, but assigning everything a number seems very military to me. Important tourist attractions are also shown in orange, as the festival coordinators are probably expecting people to come from out of town. I am interested in this map because my sister is moving to Cambodia in one month, and I know NOTHING about Phnom Penh. I chose this map of a festival because it included a lot of information that I might need as a tourist if I manage to visit her.

If you would like to see this map, look here:


The North Pole
The Moon


This image is a thermal map of the Lunar North Pole that I found on a lunar blog. The cool thing about lunar thermal maps is you can tell a lot about the terrain from the temperatures. You can clearly see the outlines of craters, and several of the larger craters are labeled so (if you happen to know lunar topography...) you can orient yourself.  A temperature scale is included so you can tell how cold it is- it appears to get as low as 25 Kelvin. The black lines are probably where the instrument hasn't gotten any data yet. I think that maps like this are awesome because they show us a little more about the moon than we previously knew, however I am a little biased since am doing research on the moon with the team that created this map. :)